[dev.icinga.com #3312] Queries for HostAvailabilityReport and ServiceAvailabilityReport still wrong in current 1.8 master #31
Comments
|
Updated by mfriedrich on 2012-10-24 18:35:05 +00:00
|
|
Updated by tgelf on 2012-10-25 15:50:33 +00:00 I don't agree on this - the result is mathematically correct. e.g.
If your report shows numbers less than one, then either the formatting in the report is wrong or your JasperReports Server is too old. What version are you using? Cheers, |
|
Updated by Enfileyb on 2012-10-25 16:33:15 +00:00 Well,from the mathematical point of view the result for "OK" is correct. But the formula that calculates the result is not correct, thats why i suggested to correct the queryString.. Currently, if a service has availability of 97%: For OK: So at least the value for Not-OK is calculated with a wrong formula and therefore the proportions in the piechart and also the legend show a result that is far from reality. If you would put brackets around "100 - icinga_availability" But you would still see "0.97% OK" and "0,03% NOK" in the legend of the piechart. So either we have to set brackets to correct the formula and and format the value for the legend, or we just remove the "/ 100". Regards, Enfileyb |
|
Updated by tgelf on 2012-11-26 09:24:48 +00:00 You're right, the brackets are missing - this should be fixed. Cheers, |
|
Updated by mfriedrich on 2012-11-29 16:26:57 +00:00
|
|
Updated by Anonymous on 2012-12-04 22:48:36 +00:00
Applied in changeset 6cc6795. |
|
Updated by wolle on 2012-12-11 16:28:17 +00:00 It doesn't work with the current icinga-report master. I had to remove the brackets and "/100" in ./templates/sub/host/availabilityInGivenTime.jrxml ./templates/sub/service/availabilityInGivenTime.jrxml Jasperserver Version is 4.7.0, IDO, Core and Web are also installed from the current master trees. |
|
Updated by berk on 2012-12-11 16:39:48 +00:00 have you replaced the specific templates or still imported the report-package using js_import or configure? |
|
Updated by mfriedrich on 2012-12-11 19:03:35 +00:00 there might be an overlay by the fixes from michael luebben, so that the fixed jrxml did not hit the updated reporting zip. i would opt for this being updated after each commit run on git, as most users just import the zip file, and do not import the fixed files by hand into their jasper web interface. |
|
Updated by wolle on 2012-12-14 14:46:50 +00:00 i did berk's changes directly to the datafiles and rebuild the zip. after importing the "new" zip with js-import.sh my charts are looking green ;-). thanks for the hint! |
|
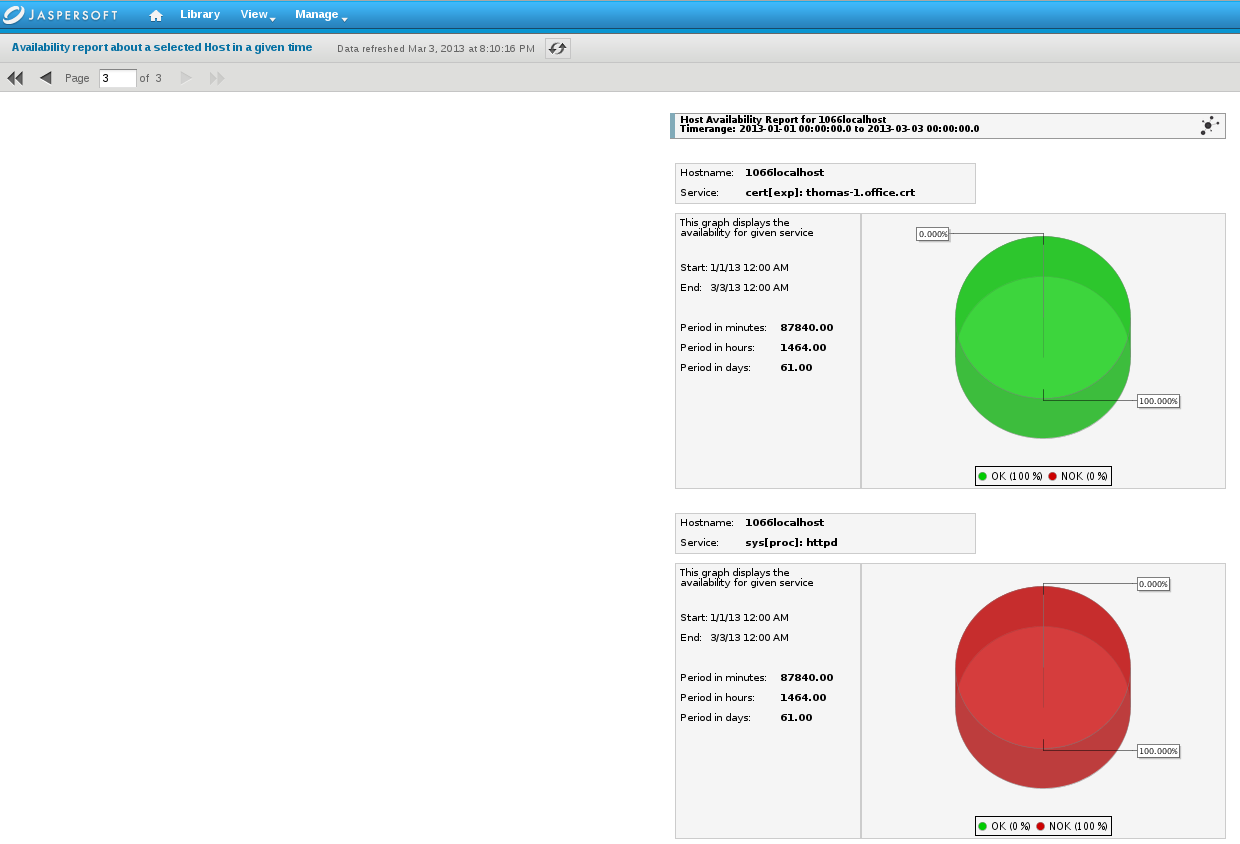
Updated by wolle on 2012-12-14 16:06:33 +00:00 i found another little issue. now, the chart values are calculated wrong. the availability of 100% is shown in the labels as 1.0 %. |
|
Updated by mfriedrich on 2012-12-16 12:19:19 +00:00
|
|
Updated by mluebben on 2012-12-18 11:47:06 +00:00
Add .multiply(100) in valueExpression and labelExpression in both files. |
|
Updated by azubi on 2013-02-26 14:22:15 +00:00 I still got the same issuse. 1 Node shows me 10% up and 99.040% down. I've tried the lates git : js-icinga-reports.zip (sha1sum = 148af791b329998da69ea70d59ebb78cc9eeee7d ) Also added the additional bracket which where mentioned above, without success. |
|
Updated by mfriedrich on 2013-03-03 16:54:48 +00:00 latest git from where? r1.8 is the current target for 1.8.2 and this is the location where michael luebben also added the fix to. https://git.icinga.org/?p=icinga-reports.git;a=shortlog;h=refs/heads/r1.8 https://git.icinga.org/?p=icinga-reports.git;a=commit;h=00bac32198acd95d5ce2c716855cb78de5fcd2de |
|
Updated by mfriedrich on 2013-03-03 19:13:04 +00:00
with the latest tree in r1.8, this works for me. |
|
Updated by azubi on 2013-03-04 09:32:18 +00:00 azubi wrote:
I've tryed again. Now I've got a different sha1sum. This time, it worked also for me. The 100% Bug & the ColorBug seems to be fixed for me. |
This issue has been migrated from Redmine: https://dev.icinga.com/issues/3312
Created by Enfileyb on 2012-10-18 15:53:49 +00:00
Assignee: berk
Status: Resolved (closed on 2013-03-03 19:13:04 +00:00)
Target Version: 1.8.2
Last Update: 2013-03-04 09:32:17 +00:00 (in Redmine)
This bug was also mentioned in #2972 (was resolved) and obviously is still present in the current master.
The queries that use "icinga_availability" in some sub-templates are still wrong:
./templates/sub/host/availabilityInGivenTime.jrxml
./templates/sub/service/availabilityInGivenTime.jrxml
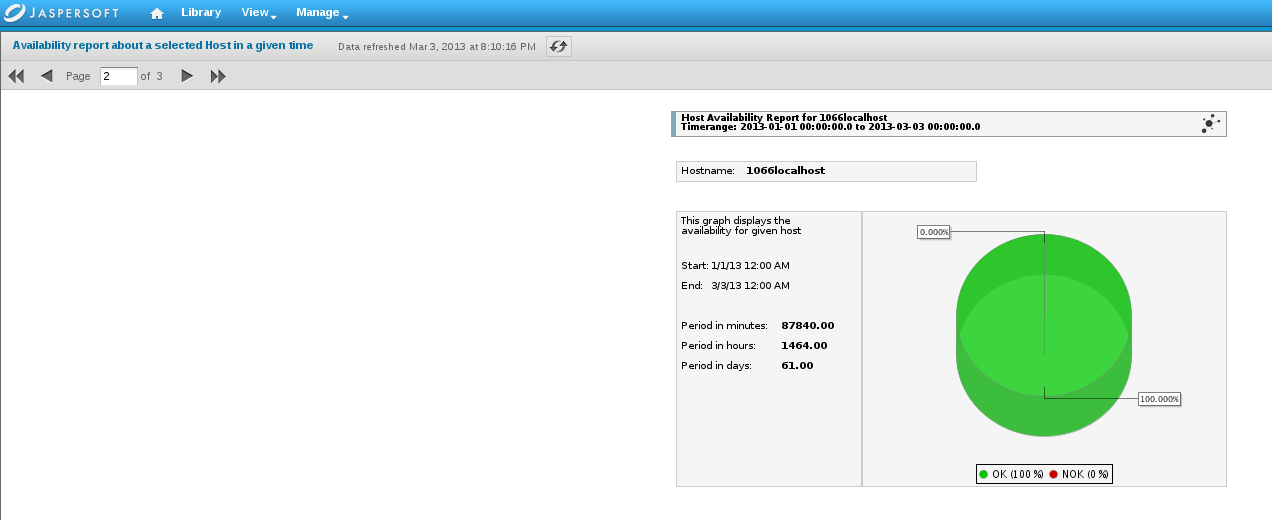
E.g. services with 100% availability, are reported with 1. Less availability results in < 1 availability.
<!\[CDATA\[SELECT object\_id, name1, name2, '0' AS state, ifnull(icinga\_availability( objects.object\_id, $P{p\_date\_start}, $P{p\_date\_end}I get graphs with correct values, if i remove " / 100 " in the queryString and import the modified jrxml-File in Jasperserver.
--> ), 0) / 100 as sla
FROM icinga_objects objects
WHERE objects.object_id = $P{p_host_object_id}
union all
SELECT
object_id,
name1,
name2,
'1' as state,
100 - ifnull(icinga_availability(
objects.object_id,
$P{p_date_start},
$P{p_date_end}
--> ), 0) / 100 as sla
FROM icinga_objects objects
WHERE objects.object_id = $P{p_host_object_id}]]>
In the following sub-templates, the query doesn't contain the " / 100", so the result is correct:
./templates/sub/host/top10InGivenTime.jrxml
./templates/sub/service/top10InGivenTime.jrxml
./templates/sub/other/hostServiceAvailabilityInGivenTime.jrxml
./templates/sub/other/hostServiceTop10InGivenTime.jrxml
Thanks,
Enfileyb
Attachments
Changesets
2012-12-04 21:59:20 +00:00 by (unknown) 6cc6795
Relations:
The text was updated successfully, but these errors were encountered: