Skip to content
New issue

Have a question about this project? Sign up for a free GitHub account to open an issue and contact its maintainers and the community.

By clicking “Sign up for GitHub”, you agree to our terms of service and privacy statement. We’ll occasionally send you account related emails.

Already on GitHub? Sign in to your account

[dev.icinga.com #8805] check cluster-zone returns wrong log lag #2568

Closed
icinga-migration opened this issue Mar 18, 2015 · 13 comments
Closed
Labels
area/distributed Distributed monitoring (master, satellites, clients) bug Something isn't working
Milestone

Comments

@icinga-migration
Copy link

This issue has been migrated from Redmine: https://dev.icinga.com/issues/8805

Created by rhillmann on 2015-03-18 21:52:10 +00:00

Assignee: mfriedrich
Status: Resolved (closed on 2015-09-25 12:25:04 +00:00)
Target Version: 2.3.11
Last Update: 2015-09-25 12:37:24 +00:00 (in Redmine)

Icinga Version: 2.3.0
Backport?: Already backported
Include in Changelog: 1

Since update to r2.3.0-1 the check "cluster-zone" displays the log lag.
In our envirenoment we watched the issue that the log lag seems not be correct:

Zone 'master' is connected. Log lag: 6 days, 14 hours, 7 minutes and 4 seconds

We have continously icinga2 service reloads, every 20min caused by puppet, but the log lag is still "behind" on our two master servers. We have seen the same problem on the other zones.
The file /var/lib/icinga2/api/log/current has current has current timestamp and icinga is continously writing on it. I am not sure how the api client gets the current log position, but it seems to be wrong in some cases.

My zone.conf

object Endpoint "hydrogenguest6.a2.rz1.domain.com" {
  host = "hydrogenguest6.a2.rz1.domain.com"
  log_duration = 2h
}
object Endpoint "fluorineguest6.b3.rz1.domain.com" {
  host = "fluorineguest6.b3.rz1.domain.com"
  log_duration = 2h
}
object Endpoint "hydrogenguest4.a1.rz0.domain.com" {
  host = "hydrogenguest4.a1.rz0.domain.com"
  log_duration = 2h
}
object Endpoint "dresdenguest6.muc.domain.com" {
  host = "dresdenguest6.muc.domain.com"
  log_duration = 2h
}
object Endpoint "hydrogenguest3.a1.rz0.domain.com" {
  host = "hydrogenguest3.a1.rz0.domain.com"
  log_duration = 2h
}
object Endpoint "chlorineguest10.a2.rz1.domain.com" {
  host = "chlorineguest10.a2.rz1.domain.com"
  log_duration = 2h
}
object Endpoint "dresdenguest7.muc.domain.com" {
  host = "dresdenguest7.muc.domain.com"
  log_duration = 2h
}
object Endpoint "hydrogenguest9.b2.rz1.domain.com" {
  host = "hydrogenguest9.b2.rz1.domain.com"
  log_duration = 2h
}
object Zone "global" {
  global = true
}

object Zone "frontend" {
  endpoints = ["hydrogenguest4.a1.rz0.domain.com","dresdenguest7.muc.domain.com",]
}

object Zone "master" {
  endpoints = ["hydrogenguest6.a2.rz1.domain.com","fluorineguest6.b3.rz1.domain.com",]
  parent = "frontend"
}

object Zone "worker" {
  endpoints = ["dresdenguest6.muc.domain.com","hydrogenguest3.a1.rz0.domain.com","chlorineguest10.a2.rz1.domain.com","hydrogenguest9.b2.rz1.domain.com",]
  parent = "master"

Attachments

Changesets

2015-09-25 12:24:45 +00:00 by mfriedrich 717118f

Fix wrong log lag in cluster-zone check

Refactor the calculation into a generic function
which is also used inside the 2.4 status API.

fixes #8805

2015-09-25 12:28:01 +00:00 by mfriedrich c3a4744

Fix wrong log lag in cluster-zone check

Refactor the calculation into a generic function.

fixes #8805

Relations:

@icinga-migration
Copy link
Author

Updated by gbeutner on 2015-03-19 07:44:05 +00:00

  • Status changed from New to Feedback
  • Assigned to set to rhillmann

Can you show me the output of "ntpdate -q pool.ntp.org" on both of your masters?

@icinga-migration
Copy link
Author

Updated by rhillmann on 2015-03-19 08:11:18 +00:00

master-1

19 Mar 09:08:05 ntpdate[17955]: 85.31.186.210 rate limit response from server.
server 85.10.200.230, stratum 2, offset -0.041075, delay 0.02910
server 212.18.3.19, stratum 2, offset -0.040033, delay 0.02625
server 85.10.246.234, stratum 2, offset -0.042321, delay 0.03168
server 85.31.186.210, stratum 0, offset 0.000000, delay 0.00000
19 Mar 09:08:10 ntpdate[17955]: adjust time server 212.18.3.19 offset -0.040033 sec

master-2

server 212.18.3.19, stratum 2, offset -0.035805, delay 0.02643
server 85.10.200.230, stratum 2, offset -0.036636, delay 0.02913
server 85.10.246.234, stratum 2, offset -0.037892, delay 0.03177
server 85.31.186.210, stratum 2, offset -0.035079, delay 0.04018
19 Mar 09:08:12 ntpdate[7660]: adjust time server 212.18.3.19 offset -0.035805 sec

@icinga-migration
Copy link
Author

Updated by mfriedrich on 2015-03-26 16:22:19 +00:00

  • Status changed from Feedback to New
  • Assigned to deleted rhillmann

@icinga-migration
Copy link
Author

Updated by smadmin on 2015-04-10 13:13:21 +00:00

We can confirm this:

Zone 'master' is connected. Log lag: 16535 days, 13 hours, 12 minutes and 41 seconds

node1# ntpdate -q ntp
server xx.xx.xx.xx, stratum 2, offset -0.000859, delay 0.02596
10 Apr 15:10:23 ntpdate[26955]: adjust time server xx.xx.xx.xx offset -0.000859 sec

node2# ntpdate -q ntp
server xx.xx.xx.xx, stratum 2, offset -0.001155, delay 0.02585
10 Apr 15:10:19 ntpdate[29290]: adjust time server xx.xx.xx.xx offset -0.001155 sec

@icinga-migration
Copy link
Author

Updated by dgoetz on 2015-07-03 06:57:23 +00:00

Perhaps some hints on the problem, I found while playing with this check:

  • Reported log lag is fine when the check is run in a local context (placed in conf.d) and same check showing the huge lag when run in cluster context (placed in zone beneath zones.d)
  • Also the replication log seems to be growing in this cases without having connection problems, so perhaps something is wrong there and the check is working fine

@icinga-migration
Copy link
Author

Updated by bfek-18 on 2015-07-16 14:01:34 +00:00

The problem is in version 2.3.7 still available.

@icinga-migration
Copy link
Author

Updated by mfriedrich on 2015-07-23 10:30:04 +00:00

  • Relates set to 9714

@icinga-migration
Copy link
Author

Updated by mfriedrich on 2015-07-24 18:12:18 +00:00

  • Target Version set to Backlog

@icinga-migration
Copy link
Author

Updated by tgelf on 2015-09-09 09:29:57 +00:00

2.3.10, issue persists.

@icinga-migration
Copy link
Author

Updated by mfriedrich on 2015-09-09 10:45:21 +00:00

  • Status changed from New to Assigned
  • Assigned to set to mfriedrich
  • Target Version deleted Backlog

@icinga-migration
Copy link
Author

Updated by mfriedrich on 2015-09-25 12:23:11 +00:00

  • File added 8805_unpatched.png
  • File added 8805_patched.png
  • Target Version set to 2.4.0

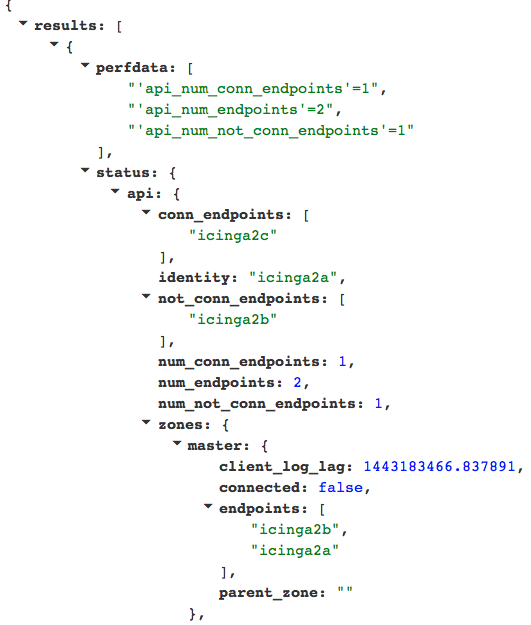
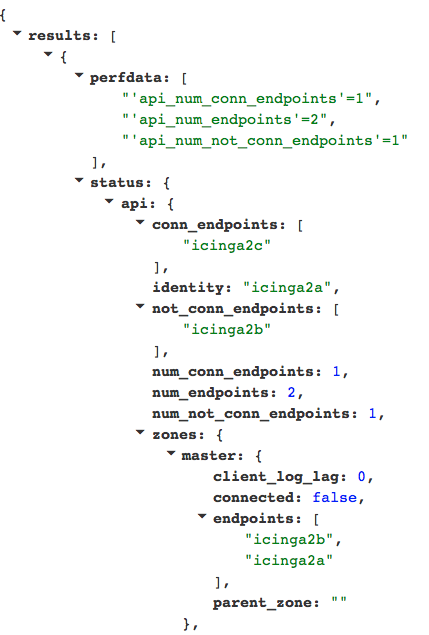
When the remote endpoint log position is 0, the lag difference is the current time which results in that output formatting.

Fix

Refactor the calculation into a function, since we use that for 2.4 inside the api status queries. Makes back porting harder, but who cares anyways.

Tests

Modified icinga2b's log position to 0, unpatched output:

8805_unpatched.png

Applied Fix

8805_patched.png

@icinga-migration
Copy link
Author

Updated by mfriedrich on 2015-09-25 12:25:04 +00:00

  • Status changed from Assigned to Resolved
  • Done % changed from 0 to 100

Applied in changeset 717118f.

@icinga-migration
Copy link
Author

Updated by mfriedrich on 2015-09-25 12:37:24 +00:00

  • Target Version changed from 2.4.0 to 2.3.11
  • Backport? changed from TBD to Yes

@icinga-migration icinga-migration added bug Something isn't working area/distributed Distributed monitoring (master, satellites, clients) labels Jan 17, 2017
@icinga-migration icinga-migration added this to the 2.3.11 milestone Jan 17, 2017
Sign up for free to join this conversation on GitHub. Already have an account? Sign in to comment
Labels
area/distributed Distributed monitoring (master, satellites, clients) bug Something isn't working
Projects
None yet
Development

No branches or pull requests

1 participant